Plotting as a GeoSeries Dashboard#
This notebook shows how to explore a subset of LiPD datasets and create GeoSeries objects in Pyleoclim.
import joblib
import os
from pathlib import Path
import pyleoclim as pyleo
# Load the GeoSeries from file
data_path = Path(os.getcwd()).parent.parent / 'data'
gs_list = joblib.load(data_path/'lipdverse_data.joblib')
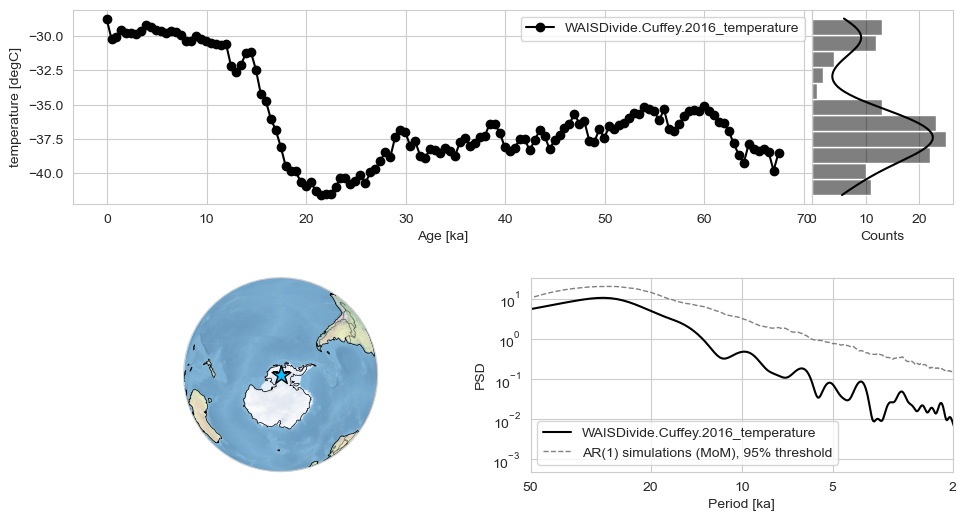
ts_interp = gs_list[0].convert_time_unit('kyr BP').interp(step=.5) # interpolate for a faster result
fig, ax = ts_interp.dashboard(figsize=(8, 6))
Performing spectral analysis on individual series: 100%|██████████| 200/200 [00:00<00:00, 484.32it/s]